Tie Breaker Infographic
This infographic illustrated the rules and why drawing lots was possible.

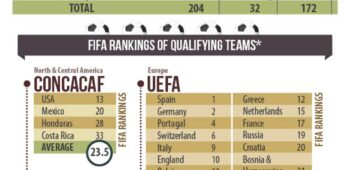
Road to the World Cup
This infographic was designed to illustrate what a long road it was to make it into the World Cup and the rankings of all the qualifying teams.
World Cup Winning History
This infographic looks at the World Cup winners history and shows the results of the 19 finals from 1930 to 2010.
Leading Goal Scorers Infographic
This infographic illustrates the leading goal scorers and their associated countries in the 2014 World Cup. It was updated regularly to reflect changes in the leader standings.
Super Bowl vs. World Cup Infographc
This infographic illustrates the differences and similarities between these two major sporting events taking into consideration many factors.
The reports are really user-friendly, and it’s easy to add in concepts for extra information. And with the new developments, it’s ...
Mariska Reinerink
Financial PlannerOur MFDA salespeople were selling mutual funds to our clients and did not have the tools to discuss a members goals and financial ...
Geoff Cook
Manager, Wealth AdvisoryI’ve been a long time user of this program and appreciate the timely, relevant content that is so well put together it is a seamle...
Marie Phillips
Wealth AdvisorFreshPlan and the infographics are presented in a way that is easy to explain and relate to the clients. Clients get it, and are n...
Scott Smith
Certified Financial PlannerFreshPlan is my go to reference tool for showing clients current financial infographics and calculating financial planning modules...
Bill Southall
Senior Financial Planning AdvisorFreshPlan is easy to use, fast and easy to understand for the clients. It avoids clustering the data and making it look complicate...
Saqib Khan
Wealth SpecialistEasy to use, customized output great quick planning tool to show concepts.
M. Armstrong
Financial AdvisorEasy to navigate, quick input and even faster results, clean layout.
J. Ong
Financial AdvisorFreshPlan is the best one stop shop for Advisors!
S. Tanner
Financial PlannerFreshPlan has been a huge time saver when I need to provide clients with registered plan info, or quick calculators to help them w...
