Canadian Retirement Infographic
This info graphic will help you speak with their clients about the changes in Canada’s Old Age Security system announced in the 2012 federal budget.
Tie Breaker Infographic
This infographic illustrated the rules and why drawing lots was possible.
No Needles
Ontario Medical Association Insurance wanted to try a visual approach to thought leadership highlighting trends and topics and approached us to help them with infographics to support their initiative.

Collaboration Toolkit Infographic
This infographic poster and companion handout illustrates McMaster’s Collaboration research.

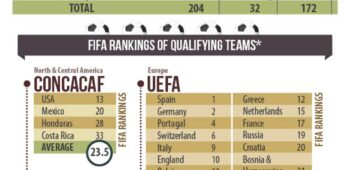
Road to the World Cup
This infographic was designed to illustrate what a long road it was to make it into the World Cup and the rankings of all the qualifying teams.
Extend Your Social Media Research
Archived: Social media continues to be a powerful tool to help you establish your personal and professional brand. Explore how you can best leverage these platforms.
Working with NexGen Clients
So it’s important to understand the differences and needs of different generations. Learn more bout working with NexGen clients.
Writing a Prospecting Letter
Most advisors know it takes about six tries before prospects are on board. A prospecting letter is often the first step, and it’s crucial to get that initial impression right. Here’s what’ll make your letter stand out.
Reality Check for Pre-Retirement Clients
Many of your clients may be moving into retirement soon. While it may be much anticipated, it will be a big change for many. As an advisor you can help. Read more about how your clients may need a reality check.
10 Tech Terms Explained
Well, it’s time to stop faking it and start learning some of today’s most important tech vocabulary. We’ll define 10 tech terms that you hear on the daily, and we’re using plain English.
World Cup Winning History
This infographic looks at the World Cup winners history and shows the results of the 19 finals from 1930 to 2010.
Leading Goal Scorers Infographic
This infographic illustrates the leading goal scorers and their associated countries in the 2014 World Cup. It was updated regularly to reflect changes in the leader standings.
