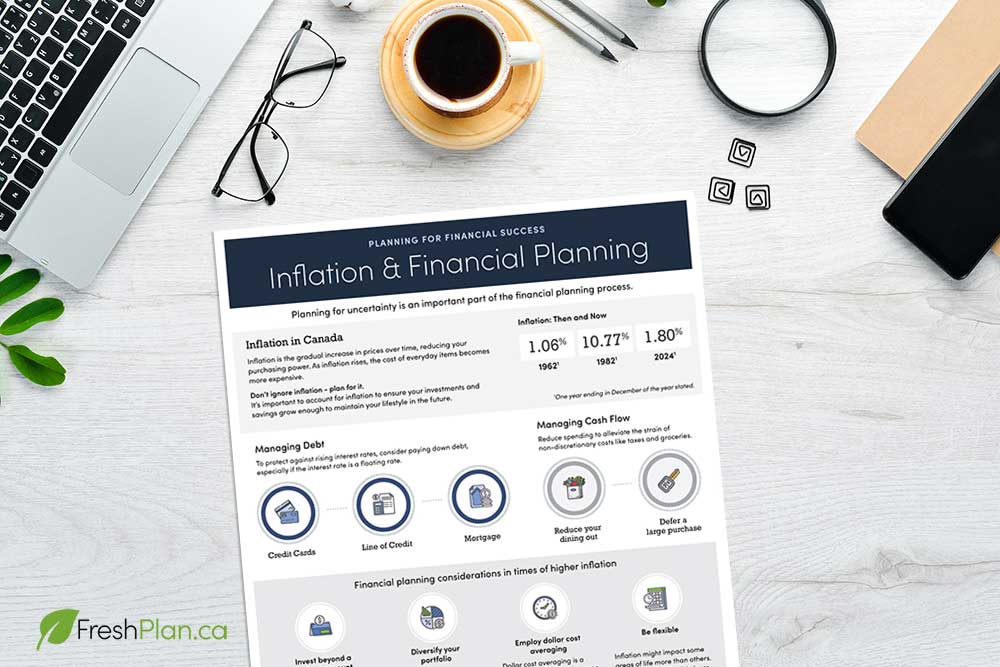
This Inflation and Financial Planning infographic illustrates the importance of planning for uncertainty. When inflation goes up it generally costs us more to purchase goods and services like gas, groceries and taxes. It also has an affect on financial planning and returns.
Inflation & Financial Planning

Illustrate the impact inflation can have on achieving your financial goals, and the importance of planning for uncertainty.
Updated with the Canadian rate of 1.8%, this infographic compares the inflation rate to the high rate of 10.77% in 1982.
Inflation and Financial Planning Infographic: A Visual Guide to Staying Ahead
The Inflation and Financial Planning Infographic is a dynamic, easy-to-understand resource designed to help clients navigate the challenges inflation can pose to their financial goals. The infographic highlights practical strategies to protect and grow wealth, such as investing beyond a traditional savings account, diversifying a portfolio, employing dollar-cost averaging, and staying flexible with financial decisions. By using simple visuals and clear explanations, this infographic helps clients grasp complex financial concepts, offering them a roadmap for how to adjust their strategies in response to inflation, market volatility, and changing financial circumstances. This tool is fully branded for financial professionals, making it an ideal resource to engage clients year-round.
Advisors Sharing Infographics
Sharing the Inflation and Financial Planning Infographic is a strategic way to empower clients with actionable insights in a digestible format. This infographic serves as both a conversation starter and an educational tool, helping clients better understand how inflation impacts their financial goals and the practical steps they can take to stay ahead. By providing your clients with this resource, you’re equipping them with the knowledge to make more informed decisions, while reinforcing your role as a trusted guide in their financial journey. It’s an easy way to stay connected and proactive with your clients throughout the year.
How Clients Benefit from the Infographic
This infographic offers a reassuring and transparent way for clients to see how their financial planning can adapt to the pressures of inflation. With its clear visuals and practical tips, it breaks down the steps clients can take to secure their financial future, even when market conditions change. It’s a friendly reminder that financial success is achievable, even in uncertain times, and this resource is a simple yet effective guide to help them stay on track.
Companion Calculator

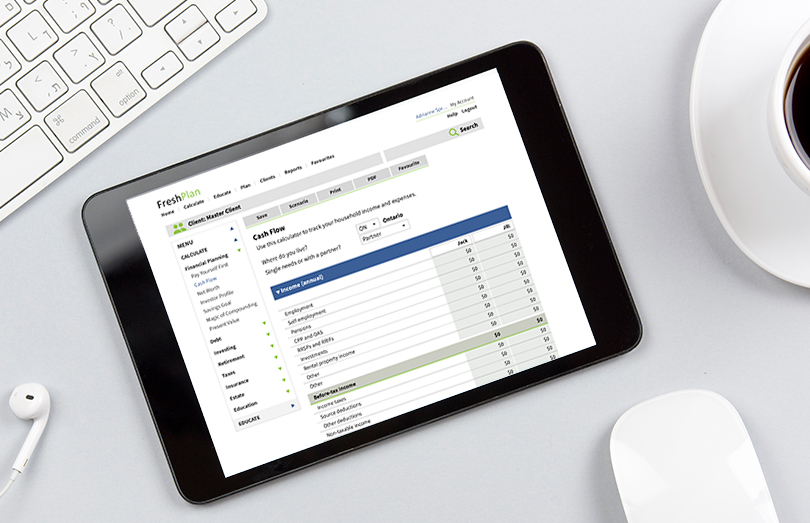
Companion Financial Management calculators help to establish your current financial situation to begin the financial planning process. Companion calculators include:
Infographic Features
Communicate Complex Concepts
Financial Infographics are an effective way to take complex ideas, filled with data and facts and simplifying the story using with visuals. When clients and prospects gain insights quickly, the content is more memorable.
Current & Shareable
Manage your client communications with current and timely vibrant infographics to share on social media, via email, in meetings or mailings.
Personalized
Infographics are personalized with the advisor name, contact information and company logo.
